

 We respect your privacy. Your information is safe.
Here is a pattern that plays out on nearly every mid-size web platform engagement, especially in agency and consultancy settings delivering to institutional clients.
Early in the project, the team establishes a QA rhythm: each ticket gets individually validated against the UAT environment before it can move forward. One QA engineer, one ticket, one verification pass. It works. Ticket volume is manageable. Cycle times are healthy. Nobody questions the process.
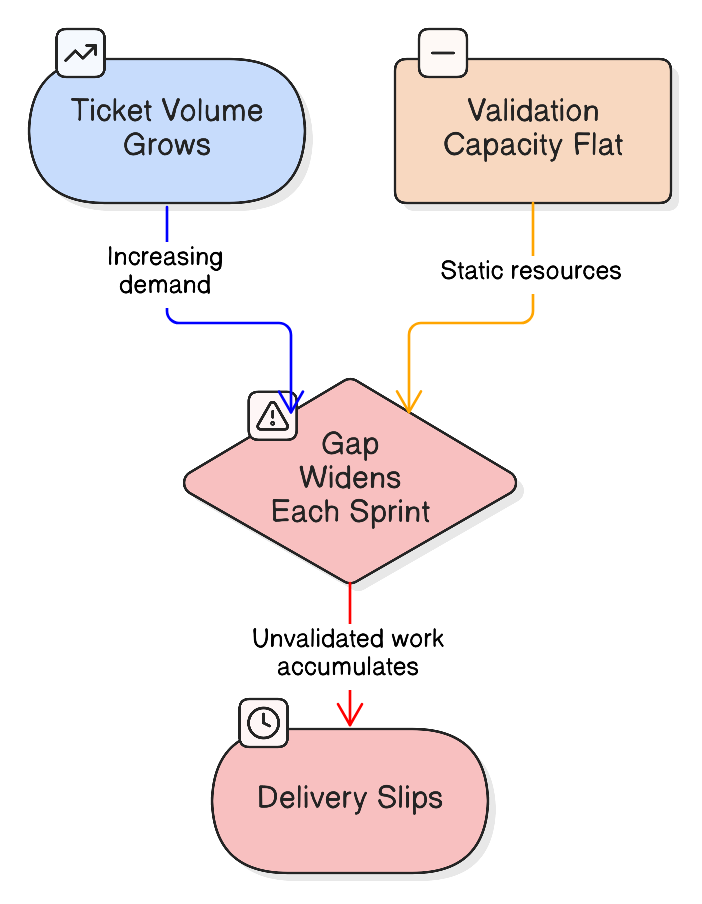
Then the project matures. The feature surface expands. Ticket volume climbs. The QA engineer is still validating one ticket at a time against UAT. The math stops working. UAT sanity becomes the critical path. Sprints slip. The delivery manager starts asking why velocity dropped. The client notices.
The instinct is to blame the QA engineer or add headcount. Both responses miss the actual problem.
The process was designed for a volume it no longer serves. It is an architecture problem, not a people problem. And it requires a structural fix, not more effort.
One of our teams recently hit exactly this wall on a platform delivery for an international organization. A lean crew of three, an engineering lead, a backend developer, and a QA engineer, raised a formal initiative after recognizing that per-ticket UAT validation had become the primary constraint on their delivery cadence. A parallel thread was opened to explore frontend sanity automation.
That initiative is still in progress. No solution has been selected. No outcomes have been measured. But the problem diagnosis was sharp enough that we started building a reusable framework around it. What follows is that framework: proposed, not yet validated by results, and shared here because the underlying problem is one we see on nearly every engagement of this size.
We will update this post when the team reaches resolution.
Why Per-Ticket Validation Breaks Down
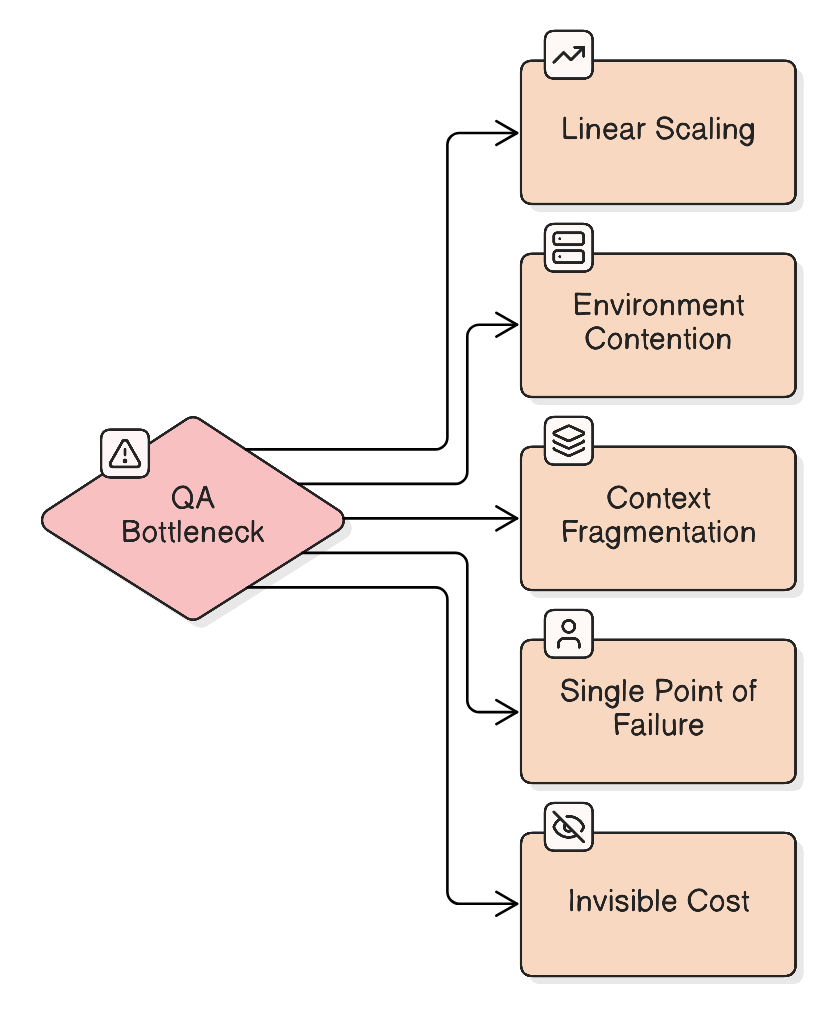
Based on this team's experience and patterns we have observed across similar engagements, per-ticket UAT validation fails for five compounding reasons. Most teams we have worked with experience at least three simultaneously, though we have not yet formally measured frequency across projects.
| Failure Mode | What Happens | Why It Compounds |
|---|---|---|
| Linear Scaling | Validation time grows 1: 1 with ticket count. Double the tickets, double the hours. | No efficiency gain from experience or pattern recognition across related tickets. |
| Environment Contention | UAT is a shared, often unstable environment. Deploys from other branches, data resets, and infrastructure hiccups interrupt validation mid-flow. | Each interruption forces a restart, not just a pause. Context switching cost is real. |
| Context Fragmentation | Validating unrelated tickets in sequence forces constant mental context switching. | Error detection quality degrades. The QA engineer catches fewer edge cases late in a validation session than at the start. |
| Single Point Of Failure | On lean teams of 3 to 5 engineers, QA is often one person. Illness, PTO, or overload creates an immediate delivery block. | No redundancy. No graceful degradation. Sprint delivery becomes dependent on one person's calendar. |
| Invisible Cost | Per-ticket validation time is rarely tracked explicitly. It hides inside "QA" as a generic line item. | Because the cost is invisible, it never gets prioritized for optimization. It only surfaces when something breaks visibly, like a missed release. |
On the platform delivery that triggered this framework, the team's experience mapped clearly to at least three of these modes. The QA engineer was the sole validator (single point of failure). The project had distinct frontend and backend layers, adding complexity to each validation pass (context fragmentation). And the bottleneck was visible enough to surface in the team's daily standup thread (invisible cost becoming visible). We do not yet have data on environment contention or precise linear scaling metrics for this project.
A Proposed Diagnostic Framework For UAT Sanity Bottlenecks
What follows is a diagnostic approach we are developing based on the failure modes above. It has not been validated through measured outcomes yet. We are sharing it at this stage because even in its unproven form, the structured conversation it forces is more useful than the ad hoc "let's just automate something" response we typically see.
The framework has two stages: diagnose, then match to intervention.
Diagnose Your Bottleneck Profile
The idea is simple: score each failure mode to understand your specific bottleneck shape before choosing a solution. Not every team has the same problem, and the wrong optimization wastes effort without reducing cycle time.
We propose scoring each failure mode on a 0 to 3 scale (0 = not present, 1 = minor friction, 2 = regular drag, 3 = blocking delivery). Have the QA engineer score independently from the engineering lead, then compare. In our experience, discrepancies between these scores are themselves diagnostic: they reveal where the pain is invisible to leadership.
| Failure Mode | Score (0 To 3) | Evidence To Look For |
|---|---|---|
| Linear Scaling | Track tickets validated per sprint vs. hours spent. If the ratio is constant regardless of volume, this is active. | |
| Environment Contention | Count UAT deploy interruptions per sprint. Count validation restarts caused by environment state changes. | |
| Context Fragmentation | Map the sequence of ticket types validated in a single session. High heterogeneity signals high fragmentation cost. | |
| Single Point Of Failure | Can someone other than the QA engineer perform sanity validation? Have they done so in the last three sprints? | |
| Invisible Cost | Is per-ticket validation time tracked as a discrete metric? Can you state the average minutes per ticket without guessing? |
We do not yet have empirical thresholds for what total scores correlate with what severity levels. Our working hypothesis: if you score 2 or 3 on three or more failure modes, your sanity process is likely constraining delivery. But that is a hypothesis, not a validated benchmark. If you use this scoring approach, we would genuinely like to hear what you find.
Match Your Profile To An Intervention
Different bottleneck profiles should call for different interventions. This mapping is our best current thinking based on the logical relationship between each failure mode and the interventions that address its root cause. None of these pairings have been tested through the active initiative yet.
| Primary Bottleneck | Proposed Intervention | Effort Level | Mid-Project Safe? |
|---|---|---|---|
| Linear Scaling | Batch validation: group related tickets by feature area or page and validate in clusters rather than individually. | Low | Yes |
| Environment Contention | Environment stabilization: dedicated UAT deploy windows, environment locking during validation, or parallel UAT instances. | Medium | Likely, with infrastructure support |
| Context Fragmentation | Ticket sequencing: reorder the validation queue to group functionally related tickets, reducing context switch cost. | Low | Yes |
| Single Point Of Failure | Cross-training: enable one additional team member to perform basic sanity validation. Define a "sanity playbook" with explicit pass/fail criteria per ticket type. | Low to Medium | Yes |
| Invisible Cost | Measurement first: instrument per-ticket validation time for two sprints before optimizing. You cannot fix what you have not quantified. | Low | Yes |
| Multiple Compounding Failures | Phased automation: implement smoke test suites covering critical paths, combined with batch validation for lower-risk tickets. | Medium to High | Likely, if phased incrementally |
One intervention mapping we are particularly confident about, even without outcome data, is this: if your primary issue is environment contention, automating tests that run against an unstable UAT will produce flaky results and erode trust in the automation itself. Automation solves scaling problems. It does not solve environment problems. Getting this sequence wrong is, in our observation, the most common mistake teams make when they decide to "fix QA. "
An Automation Scoping Model
For teams where the diagnostic points toward automation as the right intervention, the next question is scope. "Automate QA" is not a strategy. We propose categorizing tickets by type and matching each to the validation approach that best fits its risk profile.
| Ticket Category | Proposed Validation Approach | Rationale |
|---|---|---|
| Critical Path Features (login, navigation, core workflows) | Automated smoke suite, runs on every UAT deploy. | These break visibly and block everything downstream. Automation ROI is highest here. |
| UI/UX Changes (layout, styling, responsive behavior) | Visual regression tooling or manual batch review grouped by page. | Automated functional tests miss visual regressions. Batch review by page is faster than per-ticket review. |
| Content And Configuration Changes | Risk-based sampling: validate a representative subset manually, trust lower environments for the rest. | Low defect probability relative to functional changes. Full validation is likely disproportionate to the risk. |
| API And Integration Changes | Automated contract tests or integration tests in staging. UAT validation only for end-to-end user flows. | Shift left: catch integration failures before UAT. Reserve UAT for user-facing verification only. |
| Bug Fixes | Validate the fix and one regression scenario per ticket. No full sanity pass. | Targeted verification is sufficient. The original test that caught the bug becomes the regression check. |
This categorization is informed by standard test strategy patterns and by what we have seen work on similar web platform projects. It is not derived from the active initiative, which has not yet reached the tooling selection stage.
The model does not eliminate manual QA. It redirects the QA engineer's time from low-value repetitive validation to high-value activities: exploratory testing, edge case analysis, and test strategy evolution. The goal is not "zero manual testing. " The goal is ensuring that every hour of manual QA effort is spent where human judgment adds value that automation cannot replicate.
Phasing Principles For Mid-Project Optimization
The hardest constraint is timing. You cannot pause a live delivery to rebuild your QA process. Any optimization must coexist with ongoing sprints. The team working on the active initiative faces exactly this: they need to improve their process while continuing to deliver against it.
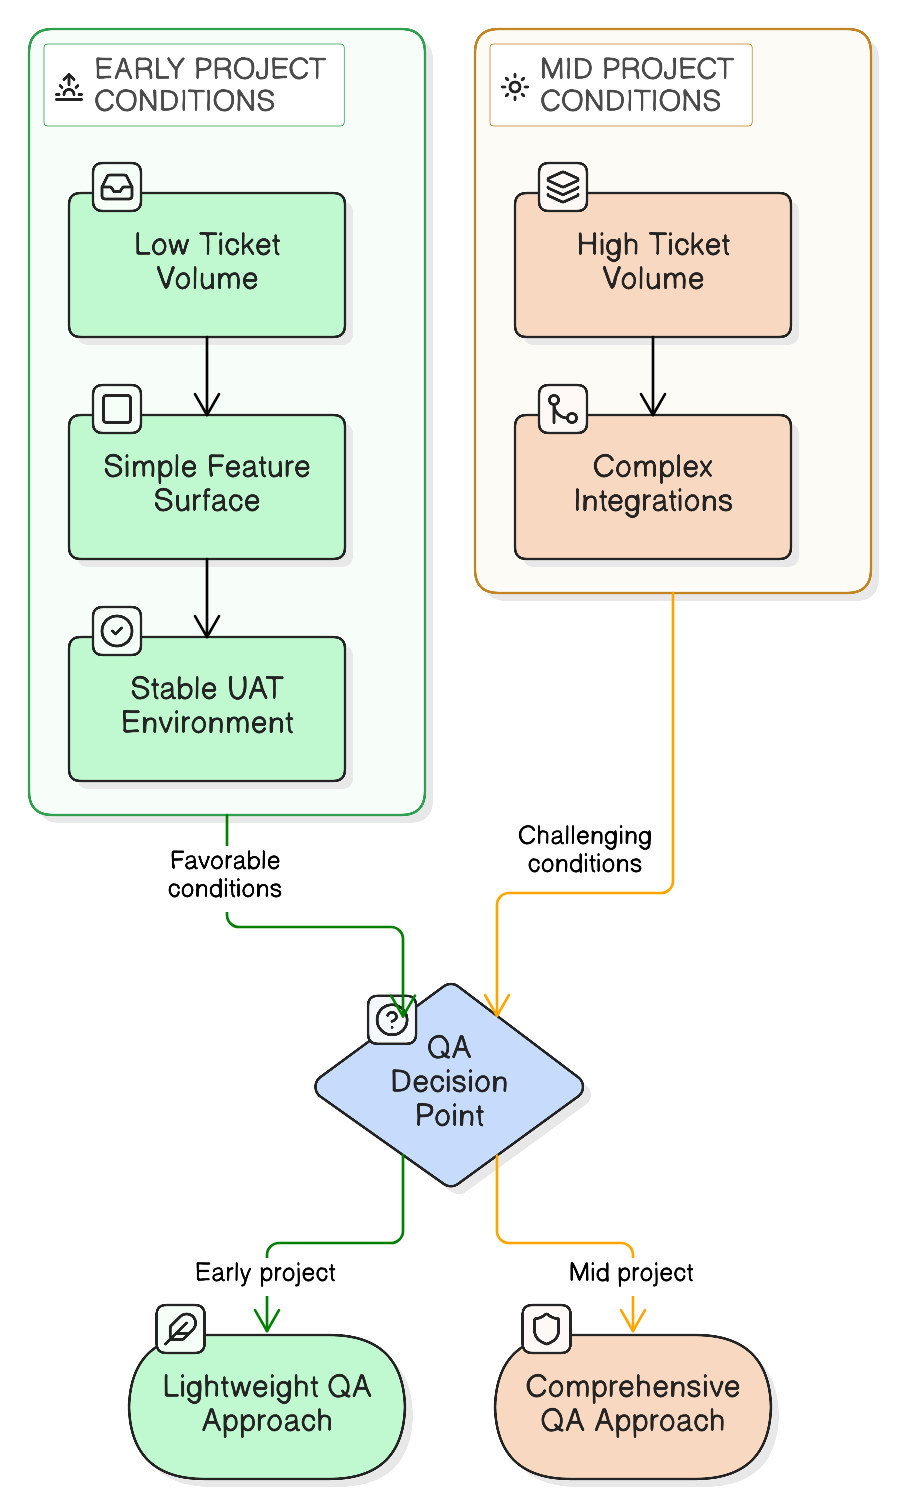
We do not yet have a tested phasing sequence from their work. But the principle we are recommending, and that they are evaluating, is: introduce one change per sprint, run it alongside existing processes before replacing anything, and measure before and after each change.
| Phase | Action | Risk Level |
|---|---|---|
| Measure | Instrument per-ticket validation time. Map ticket categories to the scoping model above. No process changes. | None. Measurement adds minimal overhead. |
| Batch | Implement batch validation for the lowest-risk ticket categories. Continue manual per-ticket validation for everything else. | Low. Batch validation is a process change, not a tooling change. Rollback is instant. |
| Parallel | If automation is indicated, begin running automated smoke tests alongside manual validation (not replacing it) to build confidence and surface false positives. | Low. No process is removed until the replacement is trusted. |
| Replace | Based on parallel running results, selectively replace manual validation where automated coverage is confirmed reliable. Measure total QA hours against baseline. | Medium. This is the first phase where manual steps are actually removed. Defect escape rate must be tracked. |
The key discipline: never skip the measurement phase. Without a quantified baseline of per-ticket validation time and total QA hours, you cannot demonstrate improvement, and you cannot detect if you have traded speed for escaped defects.
The Quality Safeguard: What To Track
One concern that rightfully surfaces whenever QA processes are optimized: are we sacrificing quality for speed? This concern should not be dismissed. It should be instrumented.
| Metric | What It Tells You | What To Watch For |
|---|---|---|
| Per-Ticket Validation Time (Minutes) | Efficiency of the process. | Should decrease over successive phases. |
| UAT Cycle Time (Hours From Deploy To Sign-Off) | End-to-end QA throughput. | Should decrease or hold stable. |
| Defect Escape Rate (Production Bugs That UAT Should Have Caught) | Quality of the process. | Must remain stable or decrease. Any increase is a stop signal. Roll back the most recent change and investigate. |
| Sprint Velocity (Story Points Delivered) | Delivery throughput. | Should increase or hold stable, confirming QA is no longer the constraint. |
If defect escape rate increases after any process change, that specific change should be rolled back. The phased approach makes this possible: each phase adds one change, so rollback is targeted rather than total.
We expect to have real numbers against these metrics once the active initiative reaches implementation. Until then, these are the leading indicators we recommend tracking, not the trailing evidence of a proven approach.
Why This Keeps Happening
This is not unique to one team or one project. Per-ticket UAT validation is the default on most mid-size web platform deliveries because it is the simplest process to establish at project kickoff. It requires no tooling, no upfront investment, and no process design. It just works. Until it does not.
The organizational pattern: processes established for early-project conditions persist long past their useful life because no one is incentivized to revisit them. The QA engineer absorbs the growing cost silently. The engineering lead sees "QA" as a fixed time block. The delivery manager tracks velocity, not QA hours. The bottleneck becomes visible only when it causes a delivery miss, or when someone is candid enough to raise a formal flag, as our team did.
The structural fix: build process review into your sprint retrospective cadence. Every four to six sprints, ask explicitly: "Is our QA process still appropriate for our current ticket volume and complexity? " If the answer requires more than five seconds of thought, it is time to run the diagnostic.
We are actively working through this optimization on a live platform delivery. The diagnostic framework in this post is our best current thinking, not a proven playbook. If you are a team facing similar QA sanity bottlenecks, we want to hear whether this diagnostic maps to your experience or misses something critical. Reach out to our engineering team and help us pressure-test the model.

Axelerant Editorial Team
The Axelerant Editorial Team collaborates to uncover valuable insights from within (and outside) the organization and bring them to our readers.

Leave us a comment